


Greater Boston Homebuyers Saw Significantly More Inventory on Sept. 30, 2026
Greater Boston homebuyers had nearly 30 percent more properties to choose from at the end of September 2026 than a year earlier. Median sale prices still rose about 2 percent for both single-family homes and condominiums.
The big picture: More inventory and slightly softer competition gave buyers more options. Condo buyers faced less competition than single-family homebuyers, according to data from MLS Property Information Network, Inc. (MLS PIN).
First, the sales picture. From January through September, single-family sales slipped less than 1 percent, while condo sales increased 2 percent.
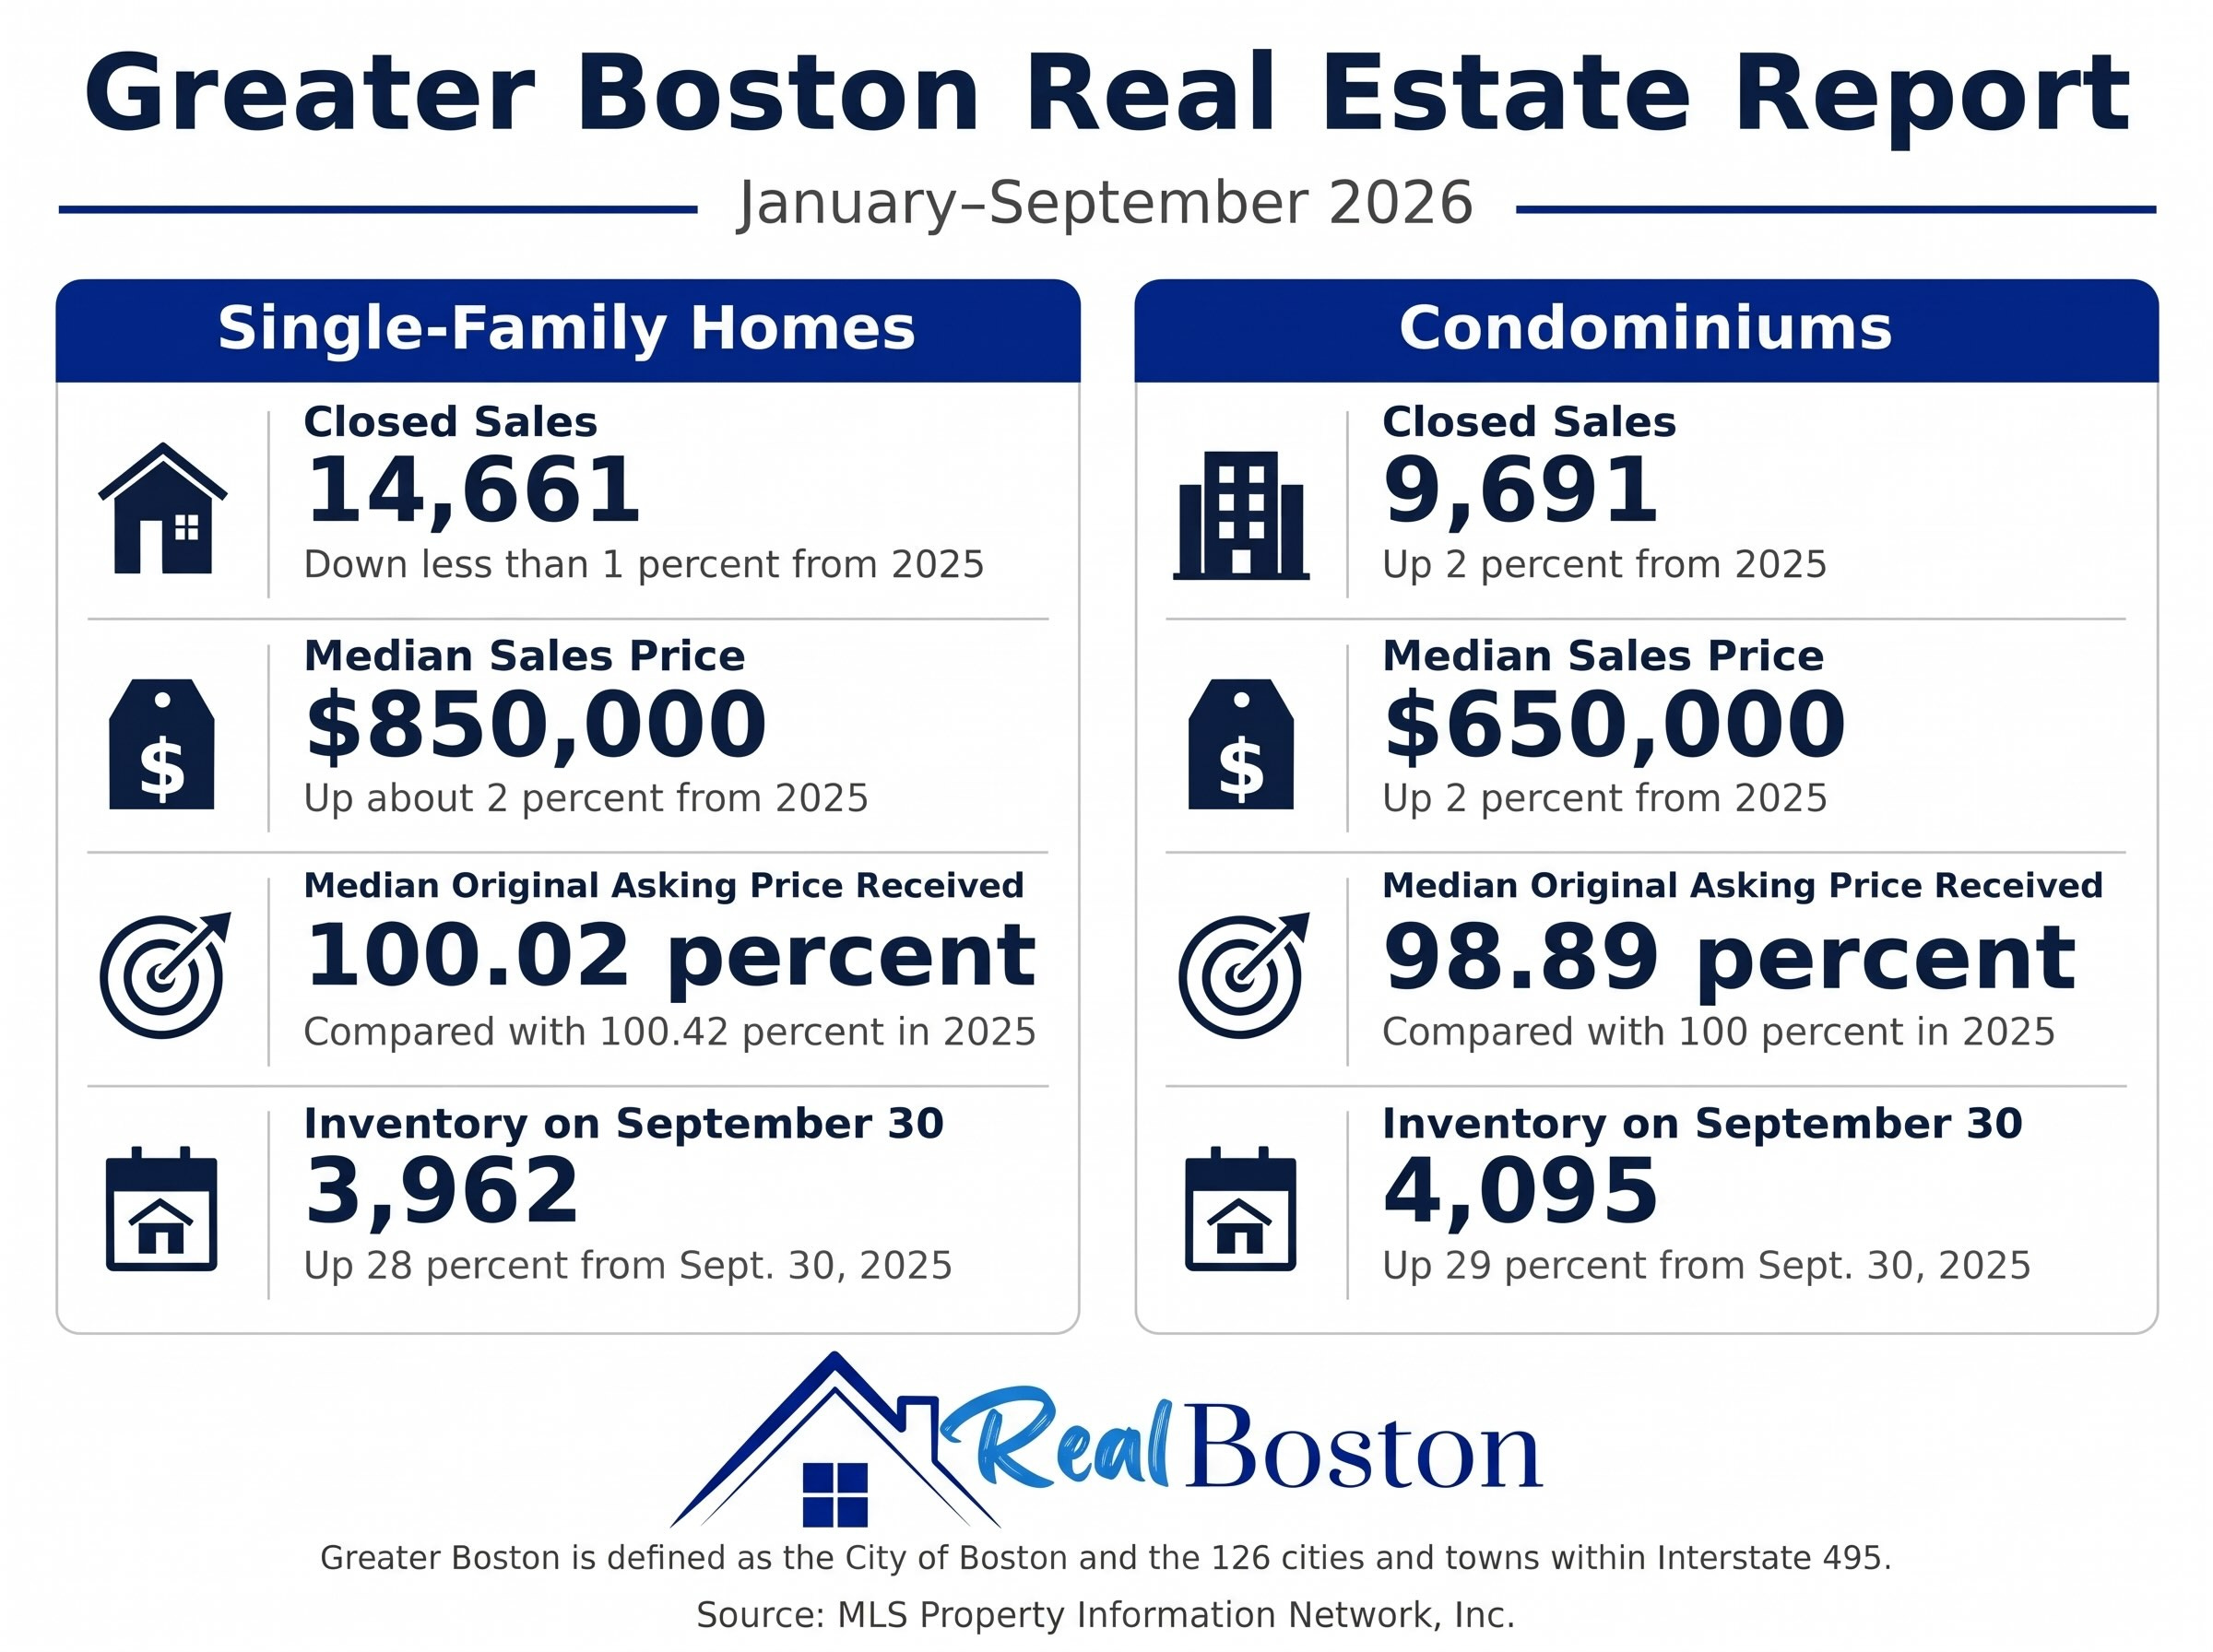
Single-family buyers continued to pay approximately the original asking price at the median. The comparable condo figure fell below the asking price.
The bigger shift: inventory. Both property types recorded substantial increases in available listings on Sept. 30 compared with the same date in 2025.
Single-family homes: 3,962 listings, up 28 percent from 3,090. That added 872 properties to buyers’ choices.
Condominiums: 4,095 listings, up 29 percent from 3,169. That added 926 units.
Months of supply also increased, reaching 2.38 for single-family homes (up from 1.86) and 3.86 for condos (up from 3.03).
Why that matters: About five months of inventory is considered a balanced market between buyers and sellers. Supply increased for both property types but remained below that benchmark.
Zoom out to the past 12 months. From Oct. 1, 2025, through Sept. 30, 2026, sales changed modestly while more listings recorded price changes.
Single-family homes: Sales were essentially flat at 19,994, compared with 19,986 during the preceding 12 months. Price changes affected 6,581 listings, up 9 percent from 6,051.
Condominiums: Sales increased 1 percent to 12,731 from 12,560. Price changes affected 6,126 listings, up 21 percent from 5,079.
The report does not identify whether those price changes were increases or decreases, but most, if not all, were price declines.
What to watch: inventory and mortgage rates. Continued inventory growth during the fourth quarter could give buyers more negotiating power.
As of Nov. 12, mortgage interest rates had declined for four consecutive weeks but remained around 7 percent. Those rates could slow fourth-quarter sales and contribute to additional inventory. A decline into the mid-6 percent range, however, would likely increase buyer activity and competition.
Source: MLS Property Information Network, Inc. For this report, Greater Boston is defined as Boston and 126 additional cities and towns within Interstate 495.
U.S. Home Sales Rise in September as Inventory Grows
Sales of existing U.S. homes increased almost 2 percent in September 2026 from August, but remained 2 percent below a year earlier, according to the National Association of Realtors®.
Sales reached a seasonally adjusted annual rate of 3.99 million. Despite the monthly gain, August and September were the year’s slowest months for sales, NAR Chief Economist Lawrence Yun said.
The national median sale price in September rose about 1 percent compared to September 2025 to $417,500, marking the 39th consecutive month of annual price increases.
National housing inventory reached 1.60 million homes, up 2 percent from August and nearly 5 percent from a year earlier. That represented 4.8 months of supply, compared with 4.5 months in September 2025.
Yun said higher mortgage rates were making it harder for buyers to qualify for purchases, while greater inventory and longer marketing times were giving buyers more negotiating power.
In the Northeast, sales declined 2 percent from August and 4 percent from September 2025. The region’s median sale price increased nearly 5 percent from a year earlier to $523,600.
The Top School Districts in Massachusetts Have Expensive Homes
Perceptions of high-quality public school districts play a big role in Massachusetts home prices. Niche, a company that provides education rankings, recently released its 2027 “Best School Districts in America” list.
Several “top” lists of Massachusetts school districts, high schools, and individual schools are released each year. Niche is just one such list.
According to Niche, its ranking factors include state test scores, college readiness, graduation rates, teacher quality, public school district ratings, and more. Niche has removed SAT/ACT scores from the 2027 rankings to “reflect a general de-emphasis on test scores in the college admissions process.”
The Dover-Sherborn Regional School District topped the list in Massachusetts. Through October, the median house price in Dover was $2,050,000. The median in Sherborn was $1,297,750, according to the Massachusetts Association of Realtors®.
Niche ranked the Needham Public Schools second. In Needham, the median price of a single-family home was $1,800,000 through the first 10 months of 2026.
The Public Schools of Brookline, as the district refers to itself, ranked third. The median house price in Brookline was $2,545,000 from January through October this year.
Rounding out the top 25 (and the corresponding median price through October) were as follows:
Lexington ($1,750,000)
Hopkinton ($1,250,000)
Weston ($2,565,000)
Belmont ($1,605,000)
Westborough ($825,000)
Winchester ($1,775,000)
Wayland ($1,215,000)
Newton ($1,850,000)
Acton-Boxborough ($998,000) / ($1,125,625)
Sharon ($900,000)
Westord ($900,000)
Cambridge ($2,460,000)
Duxbury ($1,250,000)
Wellesley ($2,383,750)
Milton ($1,134,000)
Bedford ($1,066,000)
Arlington ($1,342,000)
Andover ($1,200,000)
North Reading ($1,022,500)
Harvard ($997,500)
Natick ($1,075,000)
Shrewsbury ($692,222)